
What is AQI and How is It Measured? What is a Delhi AQI Level?

The Air Quality Index (AQI) simplifies complex pollution data into a single number, providing a clear idea of how safe the air is for you to breathe. When you check your phone in the morning, understanding delhi aqi explained helps you make sense of those fluctuating figures and their impact on your health and daily life. This system takes raw measurements of common pollutants like particulate matter (PM2.5 and PM10), nitrogen dioxide, and ozone and compresses them into an easy-to-understand scale. Knowing what is aqi and how is it measured allows you to determine whether it's a good day for outdoor exercise or if it’s better to stay indoors.
What is AQI and How is It Measured?
AQI converts complex air-quality data into one number and a colour-coded category. India uses the CPCB National Air Quality Index. It covers 8 pollutants naming PM10, PM2.5, NO₂, SO₂, CO, O₃, NH₃ and Pb.
These are measured by continuous ambient air quality monitoring stations run by CPCB, DPCC and state boards. In broader terms, these pollutants contribute in smog/pollutions people witness during winters here in India. GRAP stages are managed and enforced by Commission for Air Quality Management (CAQM).
How is AQI Calculated?
Each pollutant gets a sub-index from its concentration using linear interpolation across breakpoints. The final AQI is the highest sub-index, so the worst pollutant sets the number. Mostly, 24-hour averages are used; 8-hour averages apply for CO and O₃. For validity, data for at least 3 pollutants, including PM2.5 or PM10, must be available with sufficient hours of data.
For instance, if PM2.5 levels are at 150 µg/m³, this might yield a sub-index of 200. If no other pollutant has a higher sub-index, the AQI reported will be 200.
How Much AQI is Good?
So, 0-50 is good; 51-100 is acceptable for most people. Health impacts vary by category, with extra advice for sensitive groups (children, elderly, asthma, and heart patients).
Why is Delhi’s Air So Bad?
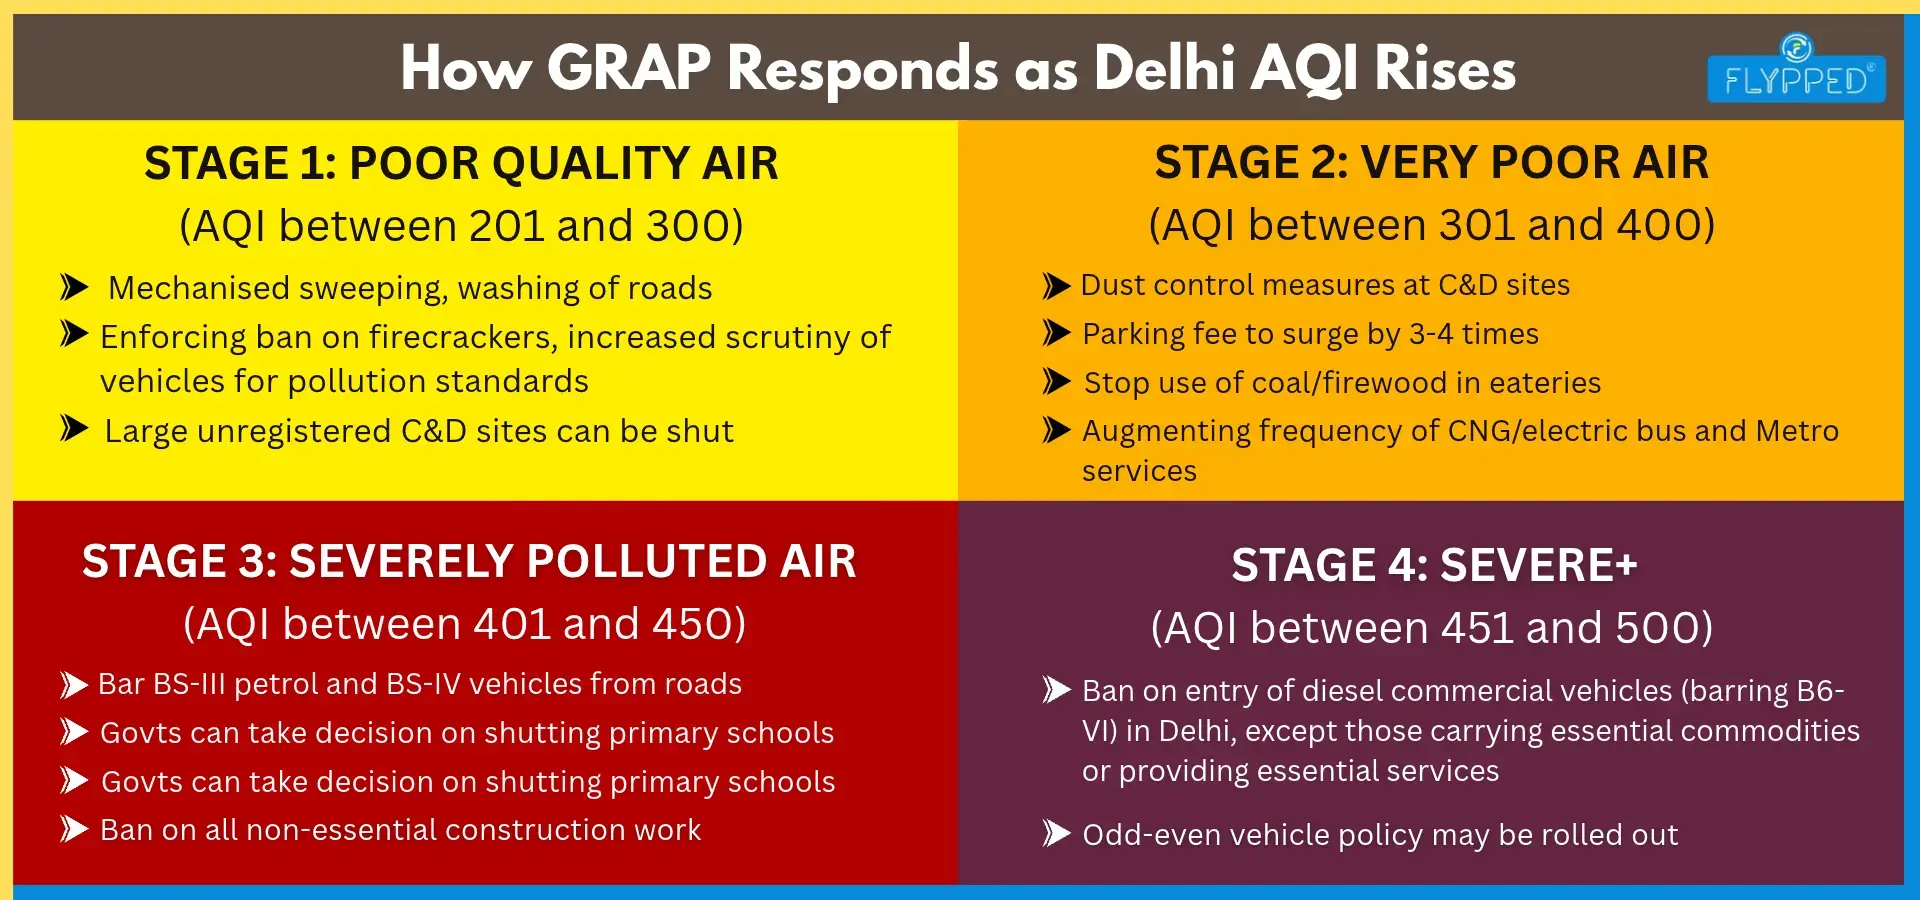
Winter drivers include low wind speed, temperature inversion and vehicular and construction dust. Seasonal peaks occur due to stubble burning (Oct-Nov), Diwali firecrackers and cold, still mornings. GRAP stages are triggered based on pollution levels; verify current thresholds on the CAQM website.
The most polluted spot changes daily; usual hotspots include Anand Vihar, Wazirpur, Bawana, Mundka, and Jahangirpuri.
Delhi AQI This Week: Weekly AQI Tracker
Last updated: [November 19, 2026] | Data period: November 12, 2026 to November 19, 2026 | Source: CPCB/DPCC
Weekly Snapshot
Average AQI for the week: 303 (Very Poor)
Best day: November 17, 2026 (AQI 204-Poor)
Worst day: November 13, 2026 (AQI 403- Severe)
Highest AQI in Delhi This Week
Station: IIT Delhi (monitored by IITM).
Date: November 13, 2026.
Value: 488 (Severe category).
Daily Delhi AQI Table
Weekly AQI by Locality
Why Did AQI Rise or Fall This Week?
Delhi’s air quality went on a roller coaster this week, starting in the "Severe" zone before briefly clearing up and worsening again.
Early in the week, calm winds and chilly temperatures trapped smoke from vehicles, dust and farm fires close to the ground, pushing the AQI past 400. Over the weekend and through November 17, stronger winds and light rain helped blow the trapped smog away, dropping the AQI down to 204 and prompting authorities to lift strict GRAP-3 curbs.
However, by November 19, the AQI climbed back up to around 282-286 as winds slowed down again, farm-fire counts jumped and relaxed restrictions allowed more local traffic and dust back into the air.
How to Protect Yourself When AQI Is High
Check AQI before outdoor activity; use N95/FFP2 masks.
Keep windows closed at peak hours; use HEPA air purifiers.
Avoid outdoor exercise when AQI is Poor or worse.
Extra caution for children, the elderly and people with respiratory or heart conditions.
Summing Up
Staying informed about air quality is essential, especially in densely populated regions like Delhi. The delhi aqi explained highlights how air pollution levels can differ from one area to another, directly affecting our daily lives and health. By grasping what AQI numbers signify, you can take necessary precautions, particularly for vulnerable groups such as children, the elderly and those with pre-existing health conditions.
Keeping an eye on local AQI variations like aqi delhi dwarka or greater noida aqi enables you to make informed choices about outdoor activities. Elevated pollutant levels can lead to immediate health issues including respiratory problems and can have long-term effects such as lung damage. So, when you check the highest aqi in delhi today or the delhi aqi now, remember that these numbers represent the air you breathe and its potential impact on your health.
By tracking air quality updates and understanding the factors that influence these readings, you can better shield yourself and your family. Taking preventive measures on high AQI days, such as wearing masks or staying indoors, can greatly reduce your exposure to harmful pollutants. As we navigate the challenges of air pollution, remaining informed and proactive is crucial for protecting our well-being. Understanding the intricacies of the delhi aqi explained empowers you to take charge of your health amidst environmental challenges.
Read More:
- Rahul gandhi petition against gyanesh kumar faces setback over 14 registry objections
- Chennai metro phase ii inauguration: pm modi rides chennai metro with cm vijay
- India rejects elon musk's starlink claims as he questions ambani over delayed approval
- Bypoll election results 2026: bjp leads in west bengal as nandigram counting continues
- India bloc third day protest: 5,000 police deployed as security tightens in central delhi
- Indigo flight struck by lightning at 17,000 feet during descent, passengers safe in lucknow
Frequently Asked Questions
Find answers to common questions about this topic
A "Good" AQI falls within the 0-50 range. In Delhi, this cleanest level is typically only achieved during the peak monsoon season (July to September) due to heavy rain washing away airborne particles.
CPCB calculates the AQI by measuring eight key pollutants (PM2.5, PM10, NO2, SO2, CO, O3, NH3, and Pb). Sub-indices are calculated for each pollutant based on 24-hour rolling averages and the highest individual sub-index value becomes the overall daily AQI.
According to live data monitored by the CPCB, the highest station AQI recorded today (October 26, 2026) in the national capital is 246 at Jahangirpuri.
Fine particulate matter (PM2.5) is the most critical pollutant because its microscopic size allows it to bypass nasal filters and embed deep into the lungs and bloodstream. It remains the dominant contributor to Delhi's severe smog, especially during the winter stubble-burning season.
Dwarka is highly impacted by open dust storms, unpaved roads and major traffic corridors near the city's edge, whereas Patparganj's pollution profile is heavily influenced by localized industrial zones and commercial freight traffic.
Ghaziabad is slightly less polluted with an AQI of 177 while Greater Noida sits lower at 152–170, making Delhi the most polluted of the three today.
The automated historical trend tracker compiles daily data logs and updates its consolidated weekly breakdown every Monday.